Today was a lot of fun. I spent some of my time “coaching” a ChatGPT Project on how to make an infographic that relied on the BOOM Concept Model Map, which I explore in this blog entry, Scaffolded Learning with Concept Mapping. This is for a knowledge booster, AI in 5: ChatGPT, I put together today (learn more about knowledge boosters).
About BOOM
BOOM is a pretty simple idea, a quadrant outline focused on:
- Brainstorm Big Ideas – Write down all the key ideas from your lesson.
- Organize & Outline – Pick one main idea and place it in the center.
- Open Connections – Link related ideas to the main idea and connect them with lines.
- Make It Meaningful – Add linking words to explain how ideas are connected and adjust as needed. (source)
Getting ChatGPT to produce an infographic that looks a certain way can be difficult. I had tried several times to specify what I wanted the end result to look like, but words didn’t seem to quite get it done. It wasn’t until I’d gone through several iterations, providing visual examples (pictures of when it got it right) that it started giving me something like what I really wanted to see:
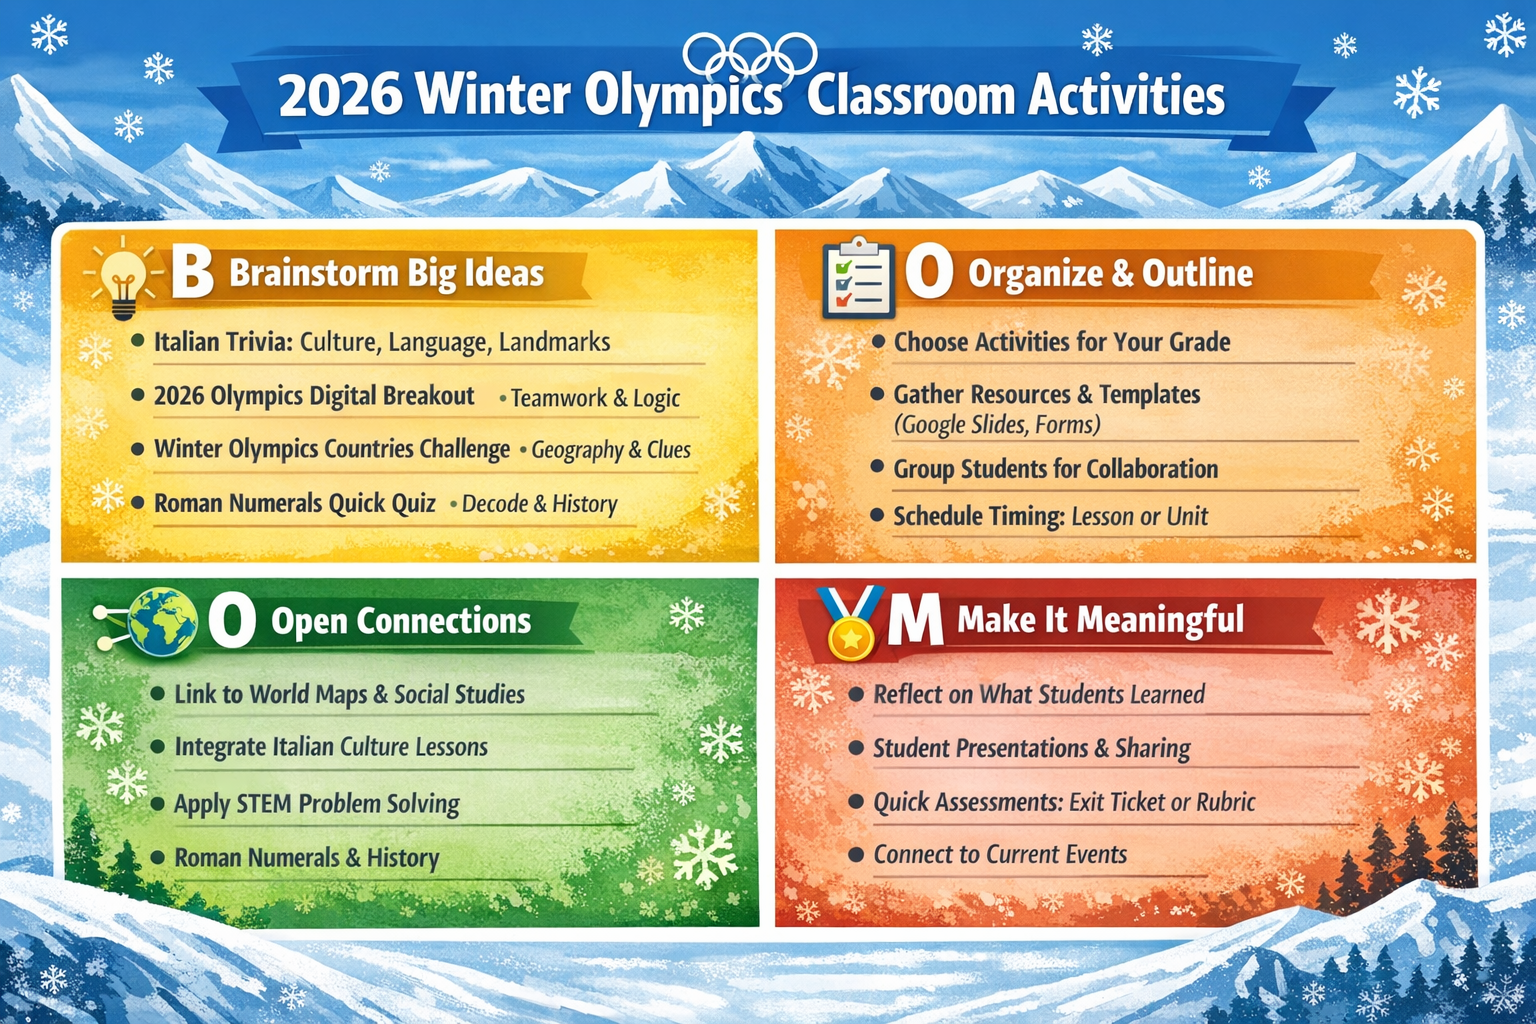
Note: This infographic is based on this blog entry by my colleague, Peggy Reimers
Modifying the Project Instructions
Modifying the Project instructions each time it got the instructions right was important, but it seems that providing an image of what was right worked better. Over lunch, it occurred to me (random thought since I was reading Corey’s Leviathan Wakes while munching on a corn tortilla taco stuffed full of a guacamole salad, oh sooo good) that I probably should try hand-drawing what I want.
That said, I used the image above as a way to get a new infographic, getting this result:
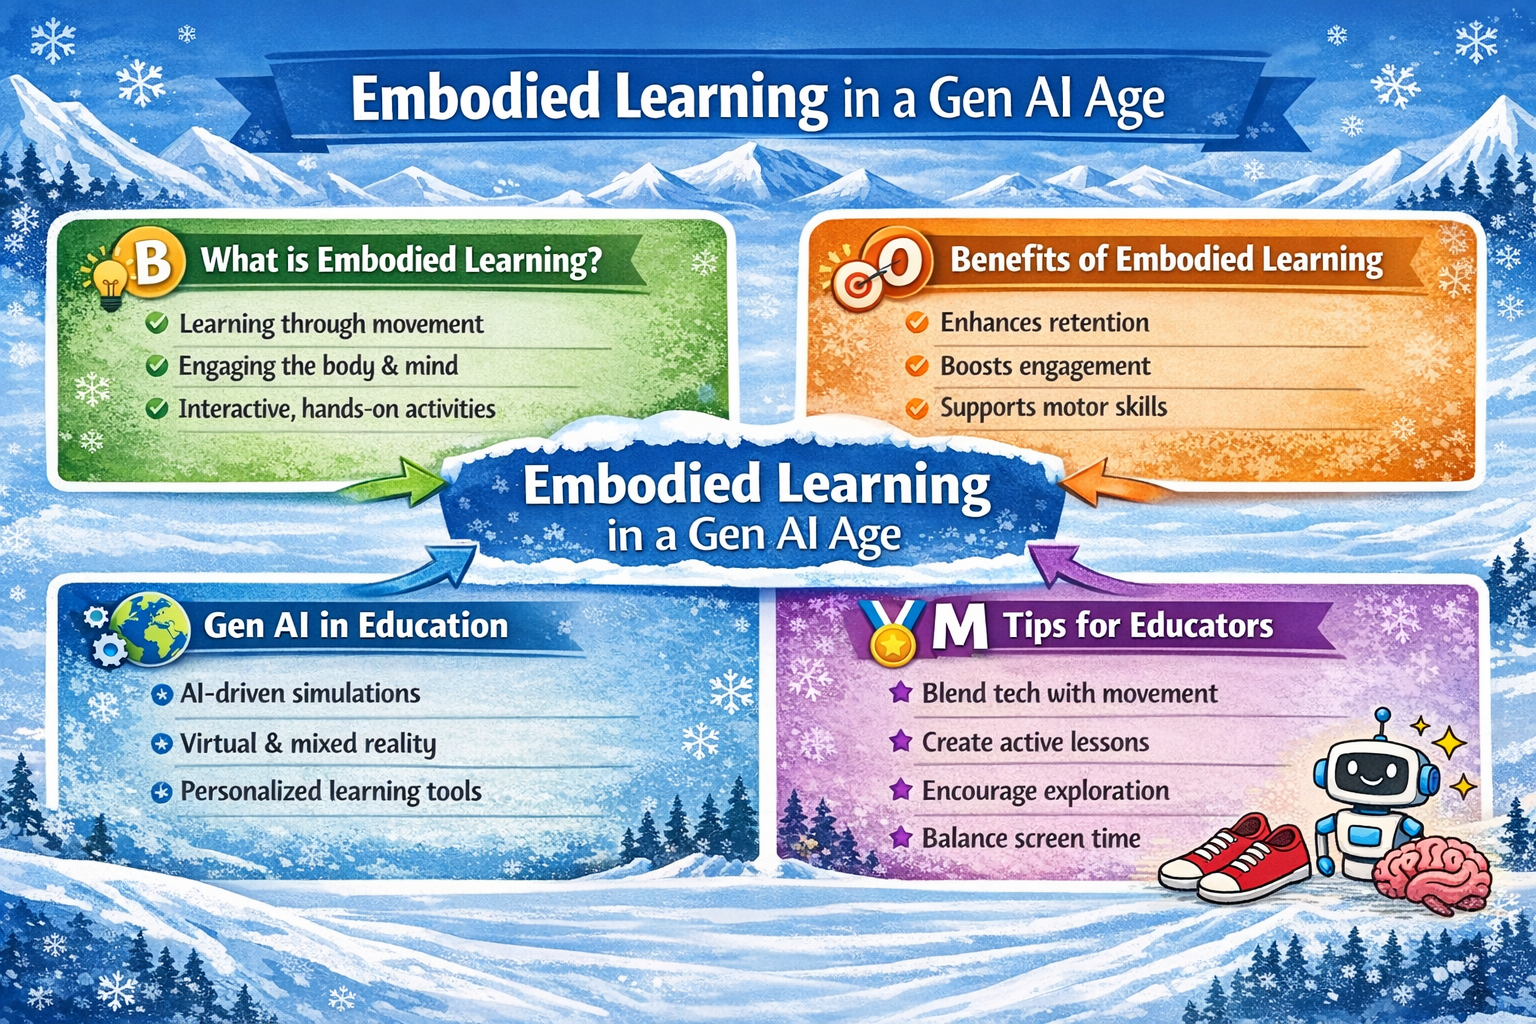
What you probably noticed right away is that it has a snow motif, snowflakes everywhere. The reason for that is that it relied on the Winter Olympics infographic as the example. It chose to add the robot, sneakers, and brain in the lower right-hand corner. At this point, I asked ChatGPT Project:
When you make an infographic like the one you just did, how should the custom instructions now read so that you do that every time from the get-go?
It’s response started like this:
Answer
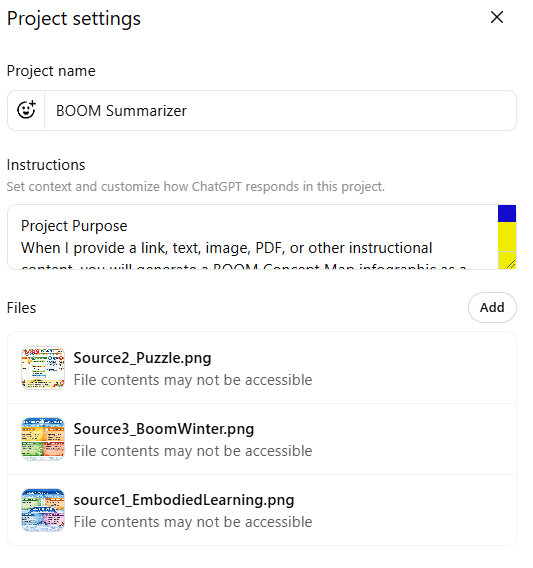
Below is ready-to-paste custom instructions you can use as-is. This will make the system generate a BOOM Concept Map PNG, visually styled like your example image, every time you provide a link, text, image, or PDF to summarize.
The interface to update ChatGPT Project instructions with instructions and examples appears below:
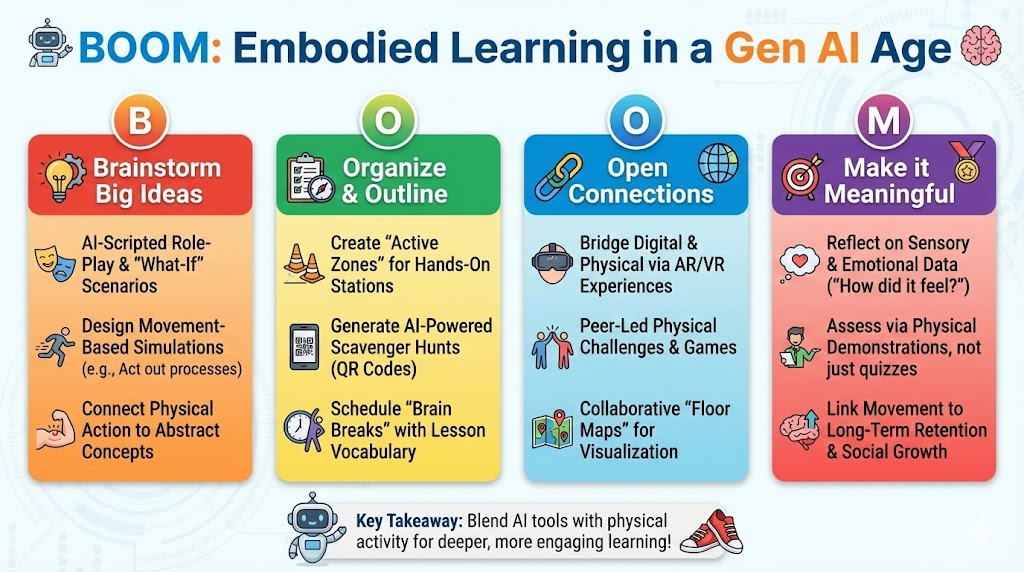
If you are wondering, is this as much hard work on Google Gemini’s Nano Banana Pro, I’m not sure. I simply gave it the prompt, the image examples in a chat, and it generated this…I don’t know about you, but that looks pretty darn good:
A Final Test
Hoping that ChatGPT and I finally got this right, I decided to try one more infographic based on a blog entry, Five Questions Texas Educators Should Ask About Data. The prompt:
Create the image infographic (landscape orientation) using BOOM framework for organizing the content
Here’s the infographic it developed based on the updated custom instructions with examples:

Hey hey, looks like success. The total process of working with the Project to get the desired outcome? About an hour. What I did next was to go get rid of the “failed” chats from the ChatGPT Project where the result didn’t yield a BOOM infographic.
What’s It All Mean?
While I can’t answer all the questions, what I was trying to do was show how to get a desired result from the Gen AI chatbot. It’s a process you go through, not something you type a short prompt in and you’re done.
Now that this is done, my hope is that I can take the instructions with updated examples and put them in a Custom GPT, a BoodleBox bot, or Google Gemini Gem and get consistent results.
Discover more from Another Think Coming
Subscribe to get the latest posts sent to your email.
