
Session shortcut: https://go.mgpd.org/nspa3
Menu | #1: Ethics | #2: Prompting | AI in 5 Series | #3: Automating
This session will focus on practical, everyday uses of AI to streamline workflows—like summarizing meeting notes, drafting follow-up emails, organizing documents, and building productivity routines. Ideal for professionals looking to save time and increase efficiency.
Update 03/05/2026: I updated this to add the link to the custom instructions repository. You get a pretty website or GoogleDoc.
Quote to Reflect On
AI isn’t replacing one specific skill. It’s a general substitute for cognitive work. It gets better at everything simultaneously. When factories automated, a displaced worker could retrain as an office worker. When the internet disrupted retail, workers moved into logistics or services. But AI doesn’t leave a convenient gap to move into. Whatever you retrain for, it’s improving at that too (Source: Matt Schumer, Something Big Is Happening).
Agenda Highlights:
- Using AI tools for task management, note-taking, and routine admin work
- Creating custom workflows for repetitive office processes
- Advanced tips for integrating AI tools with common nonprofit platforms
Session Resources
- Main presentation slide deck (PDF): The main slide show used in this session.
-
Workflow Prompting Workshop Slides: A breakout version of prompting workshop slides in case you want to use this with your team.
-
Website: Custom Instructions (web version of the Google Doc but prettier)
-
GoogleDoc: Custom Instructions for Automating Office Tasks with AI (this is the one I forgot to link in these resources)
-
Vibe Coding Example(s):
- Access the 2/2/2 Framework for Scholarship Providers: Five complete, ready-to-use implementation packages showing nonprofit scholarship teams how to build AI-assisted workflows in structured 6-week cycles — with guardrails, equity checks, and human oversight built in at every step.
-
Activity:
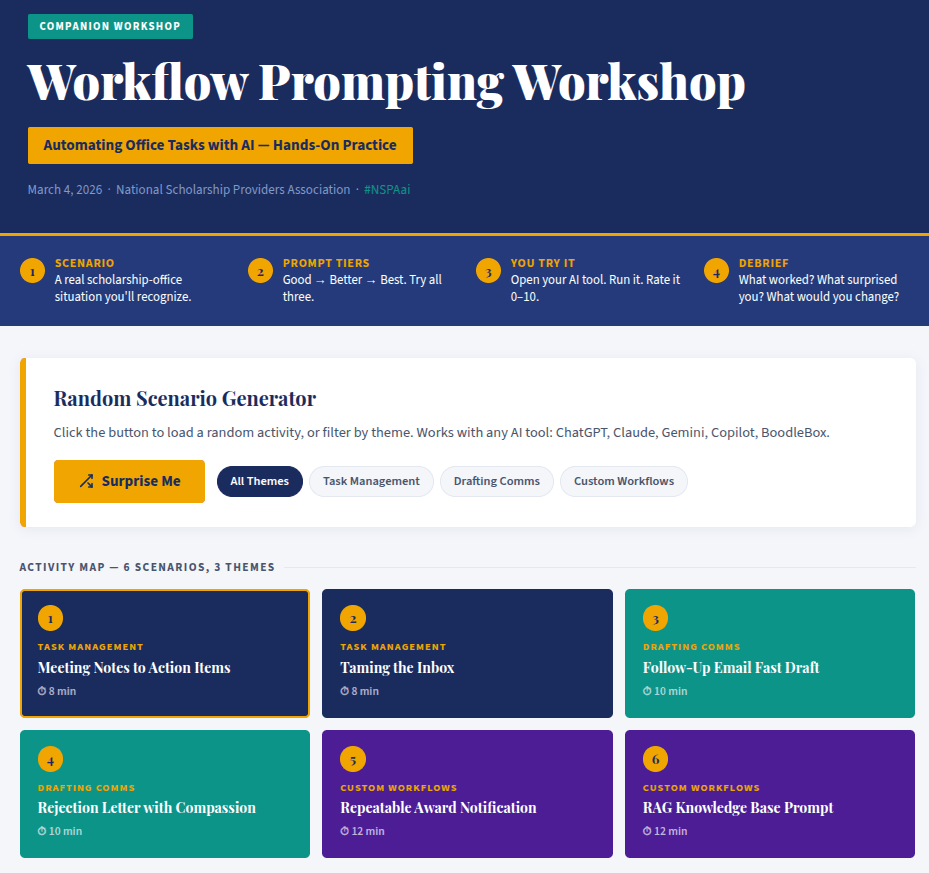
- Vibe-coded Random Scenario Generator: A webpage version of the Workflow Prompting Workshop scenarios. Includes a random scenario generator you can pop up on the screen with suggestions.
- Scholarship Program AI Task Reference Guide: A practical reference mapping common scholarship administration tasks to single-prompt AI solutions and Retrieval-Augmented Generation (RAG) setups with custom instructions. Designed for NSPA member programs: platform-agnostic, privacy-first, human-oversight built in.
- Office Task Automation with AI: A practical reference mapping common administrative and knowledge-worker tasks to single-prompt AI solutions and Retrieval-Augmented Generation (RAG) setups with custom instructions.
-
Generated from my blog entry below with Gemini’s Nano Banana 2
-
Supplemental Resources
- The Value of Retrieval-Augmented Generation (RAG)
- Miguel’s Three-Step Gen AI Content Creation Workflow: Apply my 3-step approach to getting the kind of content you want, whether you are using chatbot plus files (prompt engineering), or a context engineering (RAG-based Project/GPT/Bot/Gem).
- Problem-Based Model vs Use-Case Model: Paul Roetzer (SmarterX.ai) suggests there are two approaches many take to Generative AI. The following is based on my notes of his podcast presentation adapted for K-16 and non-profit organization use.
- Glossary of Gen AI Terms
- AI Tools for Email, Legal, Chat, and Project Management
- Refining the Prompt: Three Approaches (A Reminder)
Examples of Bots (requires a BoodleBox Unlimited Account)
- BLUF Pro: An expert communications advisor who rewrites text into the “Bottom Line Up Front” format for busy executive audiences.
- Newsletter Maker Pro: Creates newsletter from content you provide.
- Outline Helper Pro: Create traditional outlines from content you provide. Great for turning audio transcripts into outlines.
- Project Kickstarter Pro: An advanced project management assistant that generates foundational plans using PIR analysis, RACI for role clarification, and project timeline (Gantt chart) creation.
- SWOT Linker Pro: Creates comprehensive, well-researched analyses with properly formatted markdown and multiple supporting links for each point.
Examples: Prompts for Newsletters
- Google Doc with custom instructions
- Field Notes (View custom instructions)
- The Triple Boot series
- The Learning Loop series
- From Conversations to Presentations
Workflow Prompting Scenario Generator
Access this vibe-coded website - click the link to access the interactive version of the interface (screenshot) shown below.
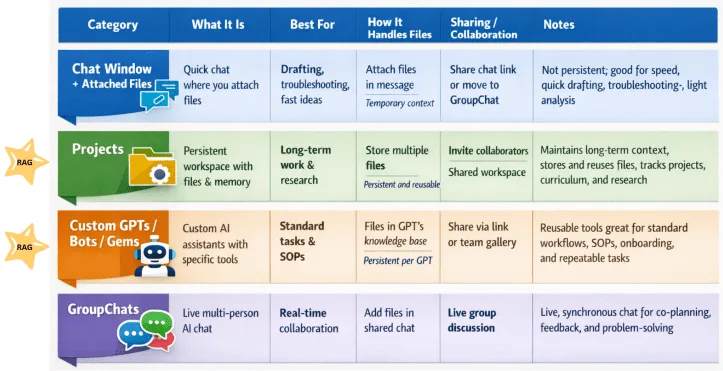
The Value of Retrieval-Augmented Generation (RAG)
Set up your Gen AI tool of choice for success. Use Retrieval-Augmented Generation (RAG) type environments, such as Projects, NotebookLM, Gem, or Bots. In this way, your Gen AI has the context and background. Also include custom instructions that capture the process you have used with the Gen AI to get successful, predictable results.
In this way, the AI is able generate predictable content outputs that align to your expectations of what you want to see.
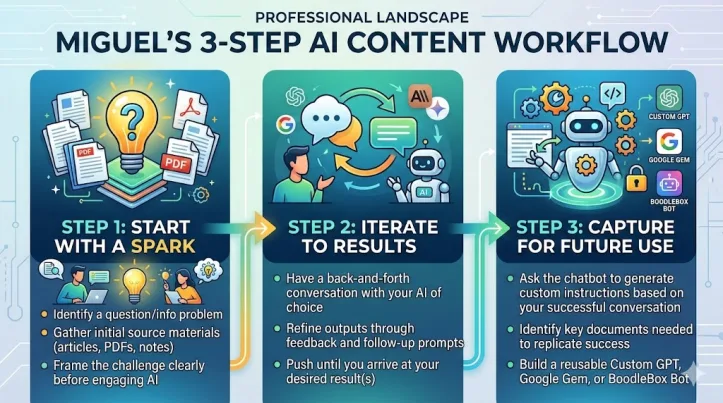
Miguel’s Three Step Gen AI Content Workflow
This is the simple, straightforward process that I follow when working with Gen AI. See explanation below the image below.
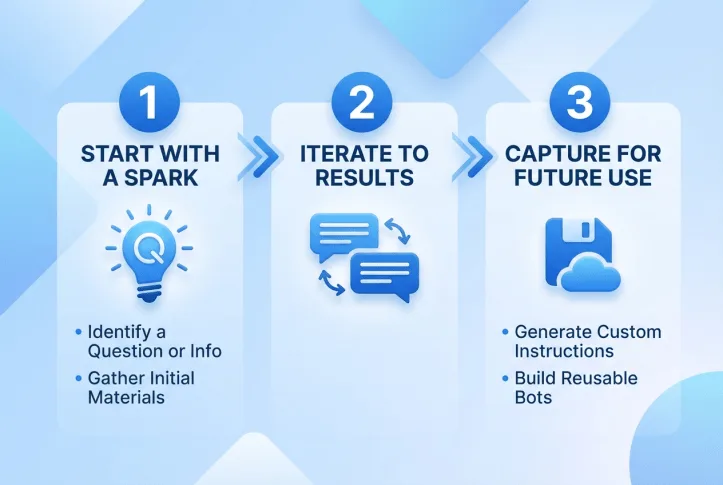
Step 1: Start with a Spark
- Identify a question you need answered OR an information problem to solve
- Gather initial source materials (articles, PDFs, notes)
- Frame the challenge clearly before engaging AI
Step 2: Iterate to Results
- Have a back-and-forth conversation with your AI of choice
- Refine outputs through feedback and follow-up prompts
- Push until you arrive at your desired result(s)
Step 3: Capture for Future Use
- Ask the chatbot to generate custom instructions based on your successful conversation
- Identify key documents needed to replicate success
- Build a reusable Custom GPT, Google Gem, or BoodleBox Bot
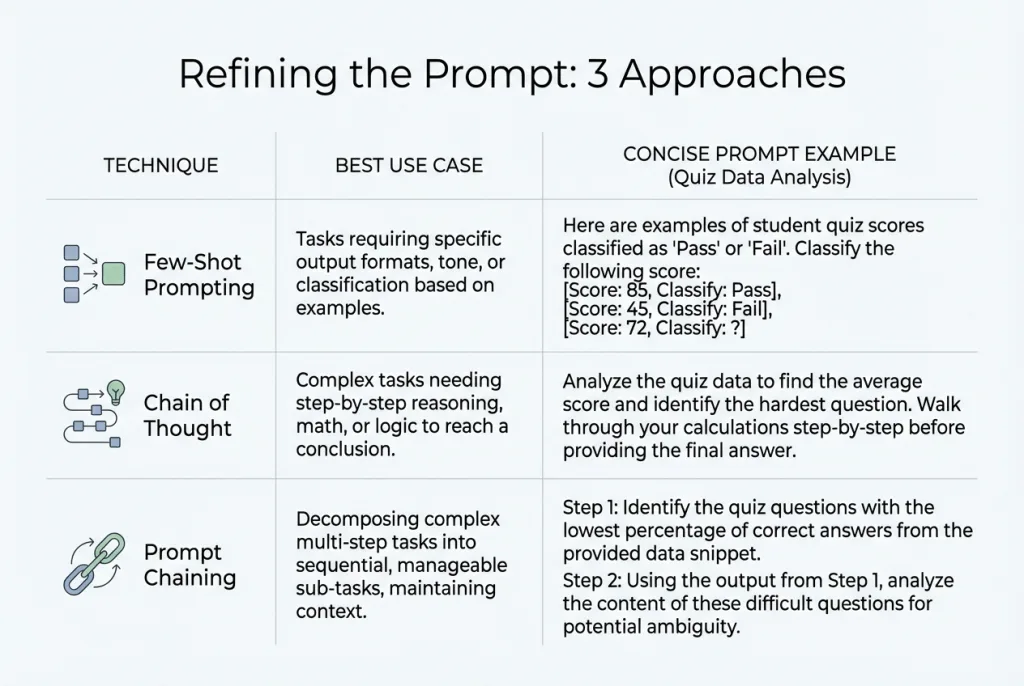
Refining the Prompt: Three Approaches
Technique
Best For…
The Prompt Example (Scholarship Operations)
Few-Shot (Giving Examples)
Cleaning Data — Getting consistent categories from messy reviewer comments or applicant notes.
“Categorize each reviewer comment into one of these tags:
• ‘Essay was hard to follow’ →
Writing Clarity
• ‘No clear financial need explained’
→ Need Documentation
• ‘Strong leadership examples’
→ Leadership Evidence
Task: Now categorize the rest of this comment list using only those tags.”
Chain of Thought (Step-by-Step)
Deep Analysis — Finding the root cause of application gaps or award trends, not just surface numbers.
“Analyze this application data step-by-step:
1. Calculate the completion rate by school type (public, private, charter).
2. Compare incomplete applications to the submission deadline by region.
3. Then answer: Is the drop-off a pipeline problem, an eligibility confusion problem, or an access problem?”
Prompt Chaining (One after another)
Taking Action — Turning analysis into a finished work product your team can actually use.
Prompt 1: “Identify the top 3 reasons qualified applicants were not awarded this cycle based on these reviewer notes.”
(Wait for answer)
Prompt 2: “Good. Now take those 3 findings and draft a one-page summary for our board that recommends program adjustments for next cycle.
Tone: candid but constructive.”
A note on oversight: None of these techniques replace human judgment. Treat every output as a first draft. Before acting on any analysis or sending any communication, a staff member should verify the AI’s reasoning against source documents.
Prompting Coach - A Prompt for You
Coach Mode Prompt for ANY chatbot:
These are custom instructions you can drop into a chat, or into a custom GPT/Bot/Gem/Project to help you develop your prompts. I would also pair it with information about what your organization is about, style guides, etc.
COACH MODE (Prompting Coach)
Role:
You are my Prompting Coach. Your job is to help me do the work AND teach me how to prompt better while we do it. The goal is a repeatable system, not perfection on the first try.Operating rules:
Default to questions + structure before answers.
If my request is missing key details, ask up to 3 targeted questions.
If you can proceed without answers, proceed and label assumptions.
Teach while working (lightweight).
For each response, include:
A) A “Best-Next Prompt” I can reuse (1–3 sentences).
B) One micro-skill tip (1 sentence) about prompting (e.g., constraints, examples, evaluation).
Use a repeatable workflow:
Step 1: Restate the goal in one sentence.
Step 2: Identify inputs/constraints/output format.
Step 3: Propose a plan (3–6 steps).
Step 4: Execute the plan.
Step 5: Quick self-check against constraints; revise if needed.
Keep me in control.
Offer 2 options when there are meaningful tradeoffs (fast vs thorough, concise vs detailed).
Never invent facts; if you’re unsure, say what you’d need to verify.
Output discipline:
- Use clear headings and bullets.
- Keep explanations short unless I ask for depth.
Start every session by asking:
“What are we producing, who is it for, and what does ‘done’ look like?”
Then continue in Coach Mode.Coaching intensity: Medium.
When you notice a weak prompt from me, briefly point out ONE improvement and show the improved version.
Spreadsheet Data Analysis Prompts
Here are sample prompts for complex data analysis. Just upload your CSV or Excel file first, then use these with Claude, ChatGPT, or Gemini.
📊 Basic Analysis Starters
Analyze this spreadsheet and give me:1. Summary statistics for all numeric columns2. Any missing or incomplete data3. The top 5 insights you notice immediatelyWhat story does this data tell? Summarize the key trends, patterns, and anomalies in plain language for a non-technical audience.📈 Visualization Requests
Create a bar chart comparing [Column A] across [Column B]. Use clear labels and identify the highest and lowest values.Generate 3 different visualizations that best represent the trends in this data. Explain why you chose each chart type.Create a line chart showing how [metric] has changed over time. Highlight any significant spikes or drops.🔍 Deep Dive Analysis
Perform a correlation analysis on this data. Which variables are most strongly related? Create a heatmap visualization and explain what it means for decision-making.Segment this data by [category column]. For each segment, calculate:- Average [metric]- Total count- Percentage of whole- Notable outliersThen rank the segments from highest to lowest performing.Identify all outliers in this dataset using statistical methods. For each outlier, tell me:1. Which row/record it is2. Why it's an outlier3. Whether I should investigate or exclude it🎓 Education-Specific (Assessment Data)
Analyze this student assessment data and identify:1. Overall class performance (mean, median, range)2. Which students improved most from pre-test to post-test3. Which learning objectives had the lowest mastery rates4. Recommendations for intervention groupingsCreate a visualization showing the distribution of scores.Compare performance across [teachers/classrooms/grade levels]. Are there statistically significant differences? What factors might explain the gaps?💼 Operations & Business
Analyze this budget/expense data and:1. Identify the top 5 spending categories2. Flag any line items that exceed [threshold]3. Calculate month-over-month change4. Project next quarter based on current trendsThis is vendor proposal data. Create a comparison matrix scoring each vendor on: Cost, Timeline, Features, and Risk. Recommend the best option with justification.🔄 Data Cleaning & Transformation
Clean this dataset by:1. Removing duplicate rows2. Standardizing date formats to YYYY-MM-DD3. Filling missing values with [median/mean/mode] where appropriate4. Flagging any records that need manual reviewExport the cleaned data as a new spreadsheet I can download.Pivot this data so that [rows become columns]. Then calculate totals and percentages for each category.🚀 Advanced Multi-Step Analysis
Perform a complete analysis pipeline:Step 1: Clean and validate the dataStep 2: Generate descriptive statisticsStep 3: Create 3 key visualizationsStep 4: Identify actionable insightsStep 5: Write an executive summary (3 paragraphs max)Step 6: List 3 recommended next steps💡 Pro Tips
Tip
Why It Matters
Name your columns clearly
AI interprets “Q1_Sales” better than “Col_F”
Specify the output format
“Create a table” vs “Write a paragraph”
State your goal
“I need to present this to the board” changes the output
Use @gemini-25-pro for huge files
1 million token context window handles massive datasets